Product analytics – Providing visibility on which product features matter using Snowplow, Bigquery and Count for Well
- Linas Leščinskas
- Mar 23
- 2 min read
“When your partner not only suggests sensible items but also proactively highlights things you hadn’t even thought about, that’s when you know you’re working with good people.”
– Matthew Brandt, Decision Engineer & Data Educator at Well
The company
Well is a Swiss health platform designed to make life easier for everyone in the healthcare sector: doctors, patients, and insurers. The Well app is a quick and secure way to check symptoms, book doctor’s appointments, order medication, and much more. The app is designed with security and integrity at its core - patients have self-determined access to health services and personal data at any time.
The challenge
Well is a Swiss startup with limited resources and a small data analytics team. Therefore they wanted to lean on Human37 to get them off to a good start. We focused on:
Providing guidance to establish metrics for user activation and retention
Understanding how the different product features influence these metrics
Prioritising product development
From a technical point of view, Well used a data warehouse infrastructure which provided a baseline of raw data. The components included:
Snowplow for data collection
BigQuery for data warehousing
BigQuery Scheduled Queries to run data pipelines
Count for collaborative data analytics and insight mining
The solution
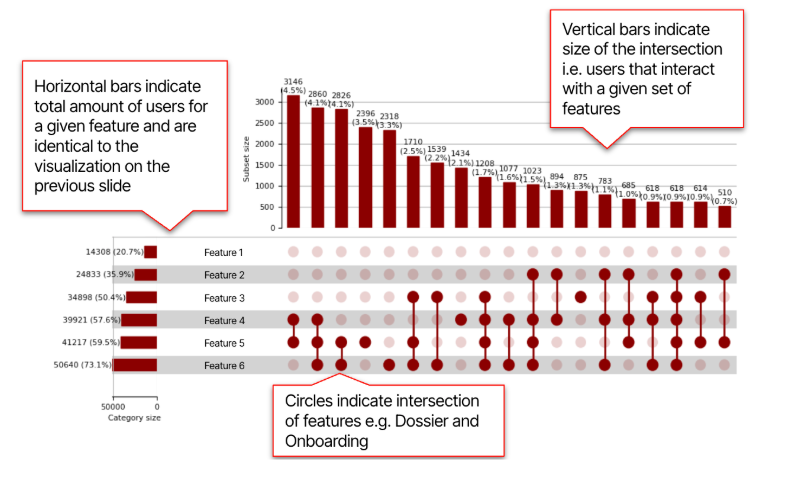
We had the raw data. Now we needed a reproducible methodology that could simplify complex raw data. 68 unique named events were clustered into 20 categories. These categories represented key components of the application. This mapping greatly reduced complexity while retaining key dimensions necessary for in-depth product analysis.

The analysis was divided into three key components:
Features
Frequency
Retention
These components served as foundational pillars for understanding user behavior from multiple perspectives.
For each component of the analysis, we set up focused internal discussions with the client. In these sessions, we collaboratively raised and refined numerous hypotheses, supported by in-depth analysis conducted using SQL and Python in Count. This iterative approach enabled us to explore the data thoroughly, validate assumptions, and uncover valuable insights. The discussions also helped prioritize hypotheses and identify areas that warranted deeper investigation.

Ultimately, we distilled our findings into a concise analysis report. This deliverable abstracted the complexity of our analysis, highlighting only the most actionable and impactful insights.

The results
The analysis revealed some interesting insights. Examples are:
A new feature in the app was barely used even though they require technical maintenance from the teams. This begs the question if they should be discontinued going forward in order for teams to focus on creating more valuable features instead.
Feature adoption over time is consistent regardless of user maturity - users tend to stick to most used features.
We identified a segment of “power users”, consisting of a sizeable percentage of the total app population. These users log in much more frequently than other users, with multiple logins per day.
Since this analysis is based on a documented methodology and all visualisations are now part of Well’s documentation it is easy to reproduce as time passes and more data is collected.
You want to know more? Feel free to reach out!
Kommentare